PAPER DEEP DIVE
Exposing the Long-tail in Embodied Urban Navigation via Scalable Learning from In-the-Wild Videos
Learning embodied urban navigation policies from real-world data is constrained by the cost of task-specific data collection and the limited coverage of rare yet safety-critical scenarios. To address these challenges, we present a scalable framework for learning point-goal urban navigation from web-scale in-the-wild egocentric videos while systematically exposing its long tail. The framework automatically annotates uncurated web videos with metric trajectories and structured navigation semantics, which are then used to train a vision-language-action policy for interpretable navigation planning. We characterize the long tail based on model performance and the distribution of perception-motion patterns, and employ reflection-based analysis to diagnose recurring failure modes. Experiments on web-video data and real-world urban navigation tasks demonstrate effective knowledge transfer from unconstrained videos and reveal coherent long-tail structures beyond aggregate navigation performance.
Paper Metadata
- Title: Exposing the Long-tail in Embodied Urban Navigation via Scalable Learning from In-the-Wild Videos
- Authors: Bingyi Xia, Han Bao, Zhewei Chen, Hanjing Ye, Jingwen Yu, Yuhan Pang, Wenjun Xu, Jiankun Wang
- Affiliations: Peng Cheng Laboratory, Southern University of Science and Technology, Hong Kong University of Science and Technology
- Link: arXiv:2608.16476 (cs.RO, submitted 2026-08-17)
- Code status: As of this deep read, neither the paper nor public search turned up an official repository. The compared baselines CityWalker, UrbanNav and SocialNav each have public implementations and can serve as reproduction references.
One-Sentence Summary
The paper converts 500 hours of in-the-wild walking video spanning 30 cities into more than half a million navigation samples with metric trajectories and structured reasoning annotations, trains WILD-Nav (a reasoning-aware point-goal urban navigation model), and then lifts the urban-navigation long tail out of aggregate metrics using two independent axes, distributional rarity and model-dependent difficulty, before attributing failures to concrete reasoning and planning steps through privileged reflection.
Background and Motivation
Urban navigation is the foundational capability for delivery robots and guide robots operating in public space. Unlike structured indoor environments or highways with explicit lane rules, open urban space is packed with dense pedestrian interaction, irregularly bounded traversable regions, and a large body of implicit social conventions that appear in no specification yet are obeyed by everyone: keep right, slow down before a crossing, leave lateral room for oncoming walkers. These constraints cannot be expressed by a pre-built map and are hard to enumerate with hand-written rules.
Traditional modular navigation pipelines decompose the problem into perception, mapping and planning stages, each relying on predefined representations and manual rules; recent navigation foundation models move to end-to-end frameworks that generalize better in such open settings. But end-to-end means the scale and diversity of supervision directly set the ceiling: the larger the model, the more it needs large-scale, broadly covering training data.
Existing supervision sources each have a hard flaw. Real-robot teleoperation is expensive to collect and geographically narrow, and public datasets typically cover a few dozen hours in a single city. Simulation data can be generated efficiently in bulk with exact labels, yet it always carries a sim-to-real gap and its scenes are predefined by designers, e.g. SimWorld consists of only 200 navigation clips. The deeper problem: both kinds of data grow inside pre-designed tasks and scenes, so they are inherently poor at exposing tail cases the designer never thought of, and they cannot answer the question of which empirical distributions a model actually fails on.
Long-tail coverage therefore becomes the central question: which navigation experiences are still missing or under-represented, and have already become the bottleneck for further improvement? The paper's observation is that first-person in-the-wild video records how humans navigate around the world at its naturally occurring distribution, which makes it simultaneously a scalable source of training supervision and an empirical testbed, since the same data can both train the model and measure which perception-motion combinations the model systematically gets wrong. The introduction states this plainly: further progress depends not only on adding more samples but on whether the task data covers the situations that genuinely constrain model behavior.
From that position the paper makes three contributions. First, a scalable automatic annotation pipeline that turns in-the-wild walking video into navigation samples with trajectory and structured reasoning supervision. Second, a web-scale urban navigation dataset of over 500K samples together with a companion baseline model. Third, a long-tail characterization method that needs no predefined scene taxonomy: it locates the tail along two axes, model-dependent difficulty and distributional rarity of perception-motion patterns, attributes failures via privileged reflection, and releases the WILD-LongTail benchmark.
Preliminaries
Task formulation of point-goal urban navigation. The paper studies local navigation planning in outdoor urban environments: with no pre-built map and no environment prior, learn a real-time end-to-end policy that plans short-horizon actions. At step $t$ the agent receives the current monocular RGB observation $I_{t}\in\mathbb{R}^{H\times W\times 3}$ and the observation history $\mathcal{I}^{\mathrm{hist}}_{t}=\{I_{t-4},\ldots,I_{t-1}\}$, plus a history trajectory vector from short-horizon odometry $\boldsymbol{\tau}^{\mathrm{hist}}_{t}=[\mathbf{p}_{t-4},\ldots,\mathbf{p}_{t}]$, where $\mathbf{p}_{i}\in\mathbb{R}^{2}$ and all positions are defined in an agent-centric ground-plane frame. Given a local point goal $\mathbf{g}_{t}\in\mathbb{R}^{2}$, the policy must output a scale-consistent short-horizon trajectory, i.e. 5 discrete waypoints $\hat{\boldsymbol{\tau}}^{\mathrm{plan}}_{t}=[\hat{\mathbf{p}}_{t+1},\ldots,\hat{\mathbf{p}}_{t+5}]$.
Reasoning-aware VLA. Beyond an executable waypoint plan, WILD-Nav also predicts a high-level meta-action $a_{t}$ and generates a structured navigation rationale $c_{t}$. This setup inherits the perception-analysis-planning decomposition of reasoning from autonomous driving (AutoDrive-P3) and the evidence that self-reflection can verify and correct planned trajectories (AutoDrive-R2). The difference is that urban navigation previously lacked a general reasoning structure learned from web video: CityWalker provides reconstructed trajectories only, and VEGA provides object-goal labels rather than navigation rationales.
Two definitions of the long tail. Most long-tail work defines the tail by low empirical frequency of predefined categories or semantic concepts. But hard cases in urban navigation are determined by joint perception and motion patterns, so object-category frequency alone is insufficient; distributional rarity and model-dependent difficulty may overlap yet need not coincide, and average performance hides high conditional error on specific sub-populations. Existing long-tail work in navigation and autonomous driving generally relies on predefined corner-case taxonomies, which presuppose prior knowledge of which situations might be hard; urban navigation lacks an equally mature long-tail taxonomy and wide natural-distribution benchmark. The paper therefore treats large-scale in-the-wild video as an empirical testbed, identifying distributionally rare perception-motion patterns and high-error samples independently, so that data coverage gaps and model weaknesses are separated.
Method
From in-the-wild video to navigation episodes: the data pipeline
The first move on the data side is geographic coverage. Video collection spans 30 cities in 15 countries (Figure 2), covering large variation in urban appearance, pedestrian behavior, traffic and social conventions, weather, lighting, crowd density and road layout; per-country duration ranges from 107 h 22 min for the USA down to 1 h 20 min for Thailand, which is itself a long tail. All videos are normalized to a single resolution and cut into 5-minute clips. In-the-wild video contains material that does not belong to a general ground-plane navigation setting, so the pipeline uses a vision-language model to detect shot cuts, subject-closeup-dominated clips, and special transition events such as doorways, stairs and elevators, and filters these clips out of the urban navigation dataset.
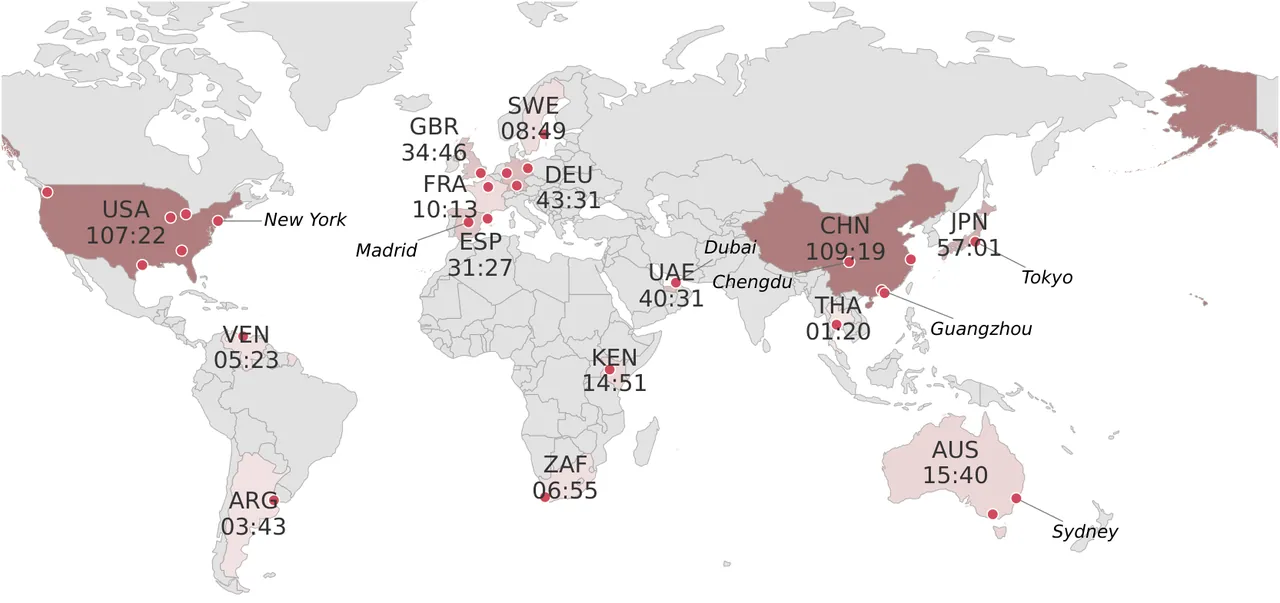
Figure 1: Geographic distribution of the collected in-the-wild walking video, 30 cities across 15 countries, annotated with cumulative hours per country.
Trajectory reconstruction. Each normalized 5-minute clip is reconstructed with LoGeR, whose visual-geometry backbone is Pi3X. Pi3X estimates reference-free per-frame camera poses and metric-scale depth, while LoGeR aligns mutually overlapping chunks with a memory mechanism to preserve long-range geometric consistency. Reconstructed camera centers are aligned to a stable initial reference frame and then projected onto the ground plane, forming a continuous walking trajectory. To use reconstructed trajectories as human demonstrations for point-goal navigation, each clip is sampled at 1 Hz and cut into 10-frame navigation episodes: 5 history frames and 5 future frames. Adjacent episodes are first grouped into temporal blocks and only then split into datasets, ensuring that highly overlapping windows never leak across the train/test partition.
Meta-action semantic labels. The high-level meta-action is a compact intermediate representation between semantic reasoning and metric waypoint planning. The pipeline maps every valid future trajectory to one of 20 meta-actions using deterministic geometric rules based on speed, lateral progress and direction of motion; after discarding invalid episodes, the categorical labels remain consistent with the continuous waypoint trajectories. Deterministic rules are chosen over letting a model annotate freely so that the intermediate representation stays auditable and recomputable.
Structured navigation reasoning annotation. Reconstructed trajectories supply action supervision but do not explain why a demonstrated path is appropriate. The pipeline first runs GroundingDINO to detect navigation-relevant objects and maps detection coordinates together with the corresponding reconstructed depth into normalized object categories, image-plane positions and depth labels. It then uses Qwen3.6VL-27B as the teacher vision-language model to generate a structured navigation rationale in the perception-analysis-planning schema: the perception field holds grounded perceptual labels; the analysis field describes predicted scene evolution, goal location, feasible traversable space, applicable interaction rules and potential collision risk; the planning field gives the rationale for the meta-action and trajectory. The key design is the separation of privileged from observable: the teacher additionally receives future observations and the rule-derived meta-action, but only as privileged verification evidence, and is explicitly required to ground the rationale in cues observable from the history and current input, so that events visible only in the future do not leak into the training annotations. Finally every annotation passes triple validation: schema completeness, meta-action label, and the ground-truth future trajectory.
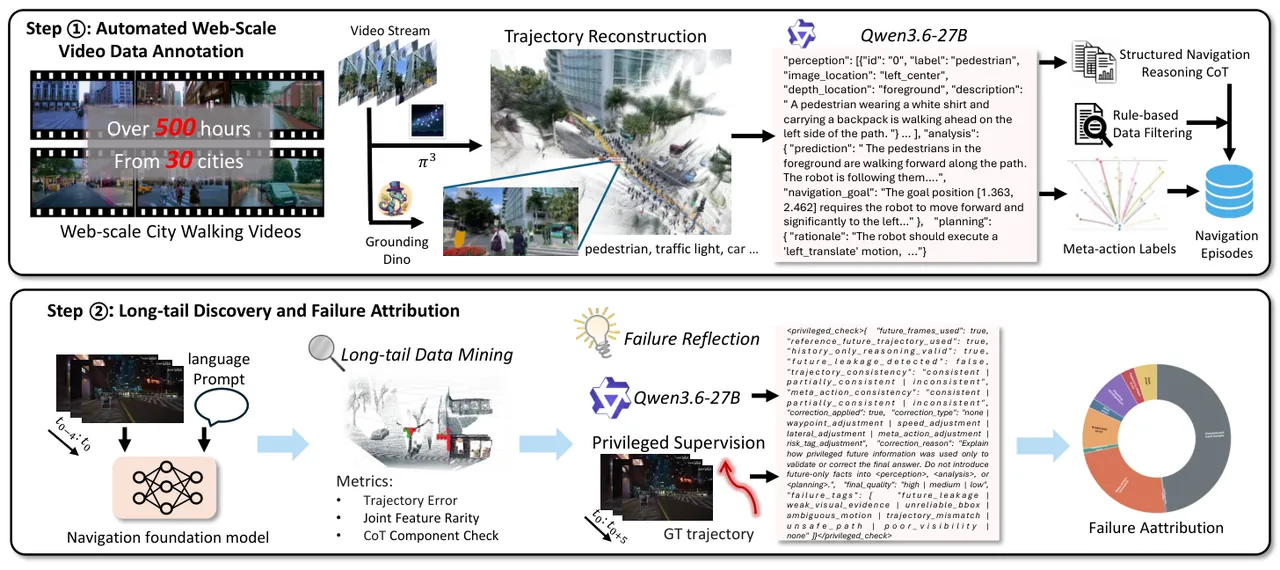
Figure 2: The two-stage automatic video processing pipeline. Stage one is automatic annotation (trajectory reconstruction, teacher-VLM structured reasoning, meta-action labels); stage two is long-tail discovery and failure attribution (rarity and trajectory-error mining, privileged reflection).
The WILD-Nav model
WILD-Nav uses Qwen3.5VL-4B as its backbone. The vision encoder turns 5 consecutive first-person observations into image tokens, interleaved with the task prompt, while the history trajectory and point goal enter as text; the vision encoder stays frozen during training. The full policy is written as
$$\left(c_{t},a_{t},\hat{\boldsymbol{\tau}}^{\mathrm{plan}}_{t}\right)=\pi_{\theta}\left(I_{t},\mathcal{I}^{\mathrm{hist}}_{t},\boldsymbol{\tau}^{\mathrm{hist}}_{t},\mathbf{g}_{t}\right).$$
To make reasoning actually serve control, the model introduces a special token <PLAN_QUERY> as the interface to an action expert. Let $h_{q}\in\mathbb{R}^{2560}$ be the final normalized language-model hidden state at that token; it aggregates the complete chain-of-thought rationale that precedes it. The action expert explicitly decodes $h_{q}$ into an executable continuous trajectory plan and consists of two lightweight output heads. The meta-action head is a linear classifier:
$$\hat{\mathbf{a}}_{t}=\operatorname{softmax}\left(W_{a}h_{q}+b_{a}\right),$$
where $\hat{\mathbf{a}}_{t}$ is the predicted categorical distribution and $W_{a}$ and $b_{a}$ are learnable. The trajectory head is a four-layer MLP with three 512-dimensional hidden layers and GELU activations:
$$\hat{\boldsymbol{\tau}}^{\mathrm{plan}}_{t}=f_{\mathrm{mlp}}(h_{q}).$$
The pretrained vision-language backbone provides a shared reasoning representation, and the two lightweight heads decode it into the low-dimensional outputs needed for precise navigation control. In the main reasoning-conditioned configuration the model first autoregressively generates the structured rationale and finishes the assistant reply, then appends <PLAN_QUERY> after the completed rationale and runs one more forward pass to produce the meta-action and waypoint plan; because $h_{q}$ attends to the full generated rationale, the action expert is explicitly conditioned on the model's own scene analysis. The efficiency-oriented variant instead places <PLAN_QUERY> before the rationale during training, so causal attention prevents it from seeing the subsequent text and planning can be done in a single pass at inference, with the rationale reduced to an auxiliary training objective. This difference is exactly the source of the two experimental variants WILD-Nav-think and WILD-Nav-inst.
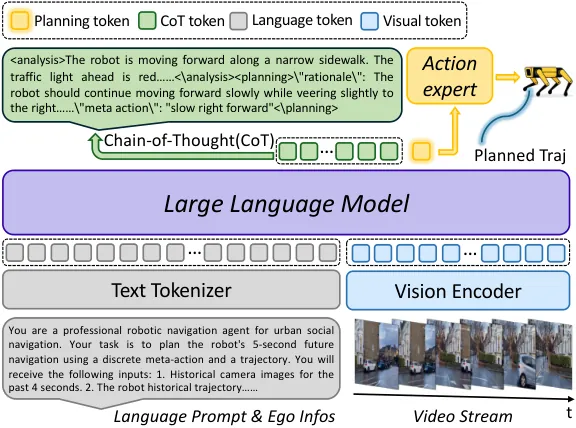
Figure 3: WILD-Nav architecture. The video stream passes through a frozen vision encoder, fuses with the language prompt, and the LLM backbone generates the chain of thought; the action expert then decodes the planning token into a trajectory.
Multi-task supervised learning
The model is optimized with three complementary objectives. First, an autoregressive language-modeling loss supervises the structured analysis and planning rationale:
$$\mathcal{L}_{\mathrm{cot}}=-\sum_{j\in\mathcal{I}_{\mathrm{ans}}}\log p_{\theta}\left(c_{t,j}\mid c_{t,<j},I_{t},\mathcal{I}^{\mathrm{hist}}_{t},\boldsymbol{\tau}^{\mathrm{hist}}_{t},\mathbf{g}_{t}\right),$$
where $\mathcal{I}_{\mathrm{ans}}$ is the index set of generated chain-of-thought tokens; the loss is computed only on the generated rationale, and input prompt, padding positions and the special <PLAN_QUERY> token are all masked. Second, the meta-action head is trained with cross-entropy:
$$\mathcal{L}_{\mathrm{act}}=-\log\hat{\mathbf{a}}_{t}[a_{t}],$$
where $a_{t}$ is the ground-truth meta-action label and $\hat{\mathbf{a}}_{t}[a_{t}]$ its predicted probability. Third, the trajectory head is supervised by mean squared error over the 5 future waypoints:
$$\mathcal{L}_{\mathrm{traj\_mlp}}=\frac{1}{5}\sum_{k=1}^{5}\left\|\hat{\mathbf{p}}_{t+k}-\mathbf{p}_{t+k}\right\|_{2}^{2}.$$
The complete objective is $\mathcal{L}=\lambda_{\mathrm{cot}}\mathcal{L}_{\mathrm{cot}}+\lambda_{\mathrm{act}}\mathcal{L}_{\mathrm{act}}+\lambda_{\mathrm{traj}}\mathcal{L}_{\mathrm{traj}}$, where the three $\lambda$ terms control relative weights. The action expert uses a higher learning rate than the language-model adapter, and the vision encoder stays fixed. The intent of this combination is clear: the language term is responsible for reading the scene, the action terms are responsible for landing that reading in metric space, and the two are coupled through the single bottleneck $h_{q}$.
flowchart TD
    A[In-the-wild walking video
30 cities, 500 hours] --> B[VLM filtering
shot cuts / closeups / doors, stairs, elevators]
    B --> C[LoGeR + Pi3X
metric trajectory reconstruction]
    C --> D[1 Hz sampling into 10-frame episodes
5 history + 5 future]
    C --> E[Geometric rules
20 meta-action labels]
    D --> F[GroundingDINO grounding
category / image position / depth]
    F --> G[Teacher Qwen3.6VL-27B
perception-analysis-planning rationale]
    E --> G
    G --> H[Triple validation
schema / meta-action / GT trajectory]
    H --> I[WILD-Nav on Qwen3.5VL-4B
frozen vision encoder]
    I --> J[Autoregressive CoT rationale]
    J --> K[PLAN_QUERY hidden state h_q]
    K --> L[Meta-action head softmax]
    K --> M[Trajectory head 4-layer MLP
5 waypoints]
    M --> N[ADE/FDE difficulty mining
union of worst 3%]
    D --> O[Joint perception-motion features
IDF rarity]
    O --> P[Rarity x difficulty two-axis long tail]
    N --> P
    P --> Q[Privileged teacher reflection
failure attributed to reasoning steps]
Figure 4: The full data-to-model-to-long-tail-analysis flow, drawn from the paper's actual method.
Long-tail discovery: rarity, difficulty and reflective attribution
Web video is both a supervision source and the empirical basis for exposing the long tail. Each episode is represented as a perception-motion pattern $z=\phi(x,y)$, where $x$ contains the visual observation, motion history and point goal, and $y$ describes the meta-action and future trajectory. Let $p(z)$ be its probability of occurrence in the corpus and $r_{f}(z)=\mathbb{E}[\ell(f(x),y)\mid Z=z]$ the conditional planning risk of model $f$; the average risk is then
$$R(f)=\sum_{z}p(z)\,r_{f}(z).$$
This decomposition explains why the long tail is hidden by aggregate metrics: a low-frequency pattern can carry very high conditional error while contributing almost nothing to average risk. The paper therefore characterizes the navigation long tail along two complementary axes, rarity measuring the empirical support of a perception-motion pattern and difficulty measuring the planning error of a specific model, and then uses reflection to check why the model actually fails on hard episodes.
Rarity conditioned on navigation. Rarity is estimated from the joint configuration of perception and motion. Open-vocabulary object descriptions are first mapped to a normalized vocabulary through lexical normalization; the perceptual representation consists of normalized object categories with coarse image-plane and depth positions; the motion representation reuses the same geometric rules that built the meta-action labels in Section 3. For episode $i$, object and spatial features are concatenated with the motion configuration into a joint feature set, feature rarity is measured with smoothed inverse document frequency, and aggregated into an episode-level score:
$$\operatorname{IDF}(a)=\log\frac{N+1}{\operatorname{DF}(a)+1},\quad s_{i}^{\mathrm{rare}}=\frac{\sum_{a\in\mathcal{F}_{i}}\operatorname{IDF}(a)}{\sqrt{|\mathcal{F}_{i}|}}.$$
Here $N$ is the total number of episodes, $\operatorname{DF}(a)$ the number of episodes in which feature $a$ occurs, and $|\mathcal{F}_{i}|$ the cardinality of all active joint features of that episode. The more low-frequency perception-motion combinations an episode contains, the higher its score; dividing by the square root of the length prevents long episodes from winning merely by feature count. This representation separates common semantic elements from uncommon navigation configurations: a pedestrian being present is common, a cyclist cutting out from behind a sign in backlit night conditions is not.
Difficulty and reflective attribution. Model-dependent difficulty is estimated with the average displacement error ADE and final displacement error FDE of the planned trajectory: ADE is the mean Euclidean displacement over all waypoints, FDE the endpoint error relative to the local goal. The paper independently takes the worst 3% of episodes under each metric and defines the hard set as their union. Privileged reflection is applied only to the hard set and uses the same teacher VLM as annotation: besides history observations and model outputs, the teacher also receives future observations and the reference trajectory for retrospective verification, checking whether the scene analysis is supported by the observation history, whether the planning rationale is consistent with the goal, and whether the trajectory is self-consistent with the meta-action. ADE, FDE, rarity scores and hard-sample ranks are all excluded from the reflection prompt, making attribution independent of the mining criterion; otherwise reflection would merely restate the mining rationale.
Failure structure at the cluster level. To diagnose failure mechanisms in hard samples, the paper first clusters on the joint features: features are compressed with SVD, mapped with UMAP into a latent space that preserves neighborhood structure, and HDBSCAN then discovers variable-density scene clusters. Six representative clusters show clearly different failure enrichment patterns: dense-pedestrian stopping scenes (C18) are dominated by planning and trajectory-shape errors; the scooter-sign context (C47) exposes rule and action errors; traffic-sign scenes (C60) amplify rule violations; interactions with scooters or cyclists (C105/C141) mainly expose prediction and collision-risk failures. Failure is scene-dependent rather than uniformly distributed.
Experimental Results
Setup
The collected in-the-wild video corpus is organized into two subsets: the first is used to fine-tune the navigation model, split 80% train and 20% test; the second is reserved for long-tail discovery and contains a mining set of 287,820 samples and an evaluation set of 104,655 samples. Three real-world navigation datasets are further unified to evaluate cross-domain adaptation, totaling 45,096 samples with train/test splits. The vanilla WILD-Nav model is trained only on the video training split; real-world data and long-tail data are introduced only in the corresponding fine-tuning experiments. Baselines are UrbanNav and SocialNav, the closest recent methods that learn visual urban navigation planning from scalable human navigation data; SocialNav with public weights is denoted SocialNav-origin, and UrbanNav and SocialNav are additionally fine-tuned on this paper's training data. WILD-Nav has two variants: WILD-Nav-inst computes planning outputs directly from instruction-conditioned features, while WILD-Nav-think first generates the structured perception-analysis-planning rationale and then computes planning outputs. All experiments run on NVIDIA V100 GPUs with 32 GB memory. Metrics are ADE, FDE and maximum angular odometry error MAOE; meta-action accuracy is reported only for WILD-Nav variants.
Video test set: can web video serve as navigation demonstration
On the video test set WILD-Nav consistently beats both baselines on every trajectory metric. Against the stronger fine-tuned SocialNav, WILD-Nav-inst reduces the three planning errors by at least 53.4%; against UrbanNav, FDE drops by 47.8%. WILD-Nav-think further reduces ADE and FDE by 8.5% and 4.2% over WILD-Nav-inst. This set of comparisons answers two questions at once: the overall advantage over baselines comes mainly from the model design (interface token plus action expert), while the additional gain of the think variant shows that structured reasoning provides useful context for continuous waypoint generation. Meta-action accuracy is 96.5% for inst and 93.4% for think, indicating that autoregressive rationale brings trajectory gains while also introducing a new error path.
| Method | Meta(%) ↑ | ADE(m) ↓ | FDE(m) ↓ | MAOE(°) ↓ |
|---|---|---|---|---|
| Video test set | ||||
| UrbanNav | – | 0.157 | 0.136 | 6.30 |
| SocialNav-origin | – | 0.906 | 1.123 | 16.53 |
| SocialNav | – | 0.470 | 0.728 | 12.65 |
| WILD-Nav-inst | 96.5 | 0.094 | 0.071 | 5.90 |
| WILD-Nav-think | 93.4 | 0.086 | 0.068 | 5.32 |
| Real-world test set: video-trained weights transferred directly | ||||
| UrbanNav | – | 0.867 | 1.493 | 13.92 |
| SocialNav | – | 3.499 | 5.824 | 19.49 |
| WILD-Nav-inst | 93.4 | 0.953 | 1.493 | 7.36 |
| WILD-Nav-think | 93.3 | 0.619 | 0.834 | 7.14 |
| Real-world test set: after fine-tuning on real data | ||||
| UrbanNav | – | 0.257 | 0.286 | 8.29 |
| SocialNav | – | 2.901 | 4.837 | 16.08 |
| WILD-Nav-inst | 89.13 | 0.206 | 0.127 | 4.49 |
Table 1: Navigation planning results on the video and real-world test sets (paper Table 2).
Real-world test set: domain gap and adaptation
Two settings are evaluated in the real world: transferring the weights learned from video directly, and fine-tuning on the real-world training split for domain adaptation. Directly transferred models show significantly higher error, indicating that differences in camera viewpoint and motion constraints create a substantial domain gap. After real-world fine-tuning, WILD-Nav-inst achieves the best trajectory performance, reducing FDE and MAOE by 55.6% and 45.8% respectively against the runner-up UrbanNav. Its ADE and FDE nevertheless remain above the levels seen on the video test set, so fine-tuning does not fully close the domain gap; the authors attribute this to the real-world training set being far smaller than the video dataset and covering fewer visual and motion patterns. Qualitative results (Figure 7) show that the fine-tuned WILD-Nav-inst deployed on a mobile robot produces trajectories that consistently stay inside the traversable region or surrounding constraints across pedestrian interaction, intersection turns, sidewalk obstacles and signalized crossings.
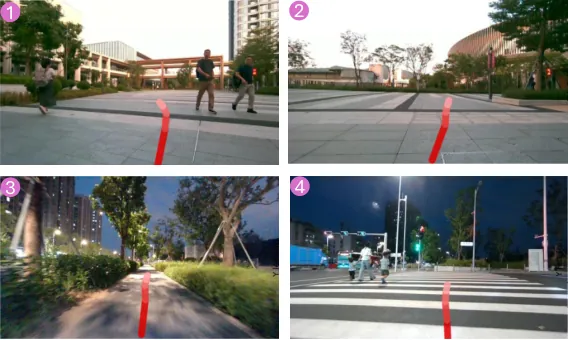
Figure 5: Real-world navigation performance. Red is the model-planned trajectory, covering daytime plazas, evening sidewalks and night-time signalized crossings.
Long-tail evaluation protocol and results
The operational definitions on the long-tail side are: samples in the top 5% of the rarity score count as rare perception-motion patterns; difficulty is defined by WILD-Nav-inst behavior, and the hard set covers 4.92% of the entire long-tail mining set. The overlap of the two axes gives the key reading: 24.18% of hard episodes are rare, while 14.48% of rare episodes are hard. Joint analysis therefore separates two kinds of tail: common-but-hard cases reveal systematic model limitations, whereas rare-and-hard cases carry both weak data support and high model error. Both the rarity scores and the error distribution are right-skewed long tails.
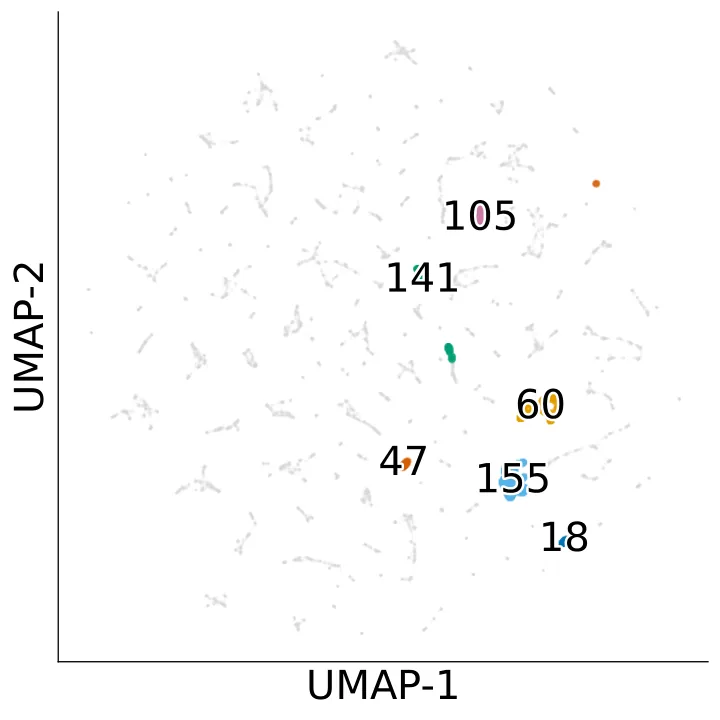
Figure 6: UMAP visualization of six representative HDBSCAN clusters in the hard set; gray points are the remaining samples.
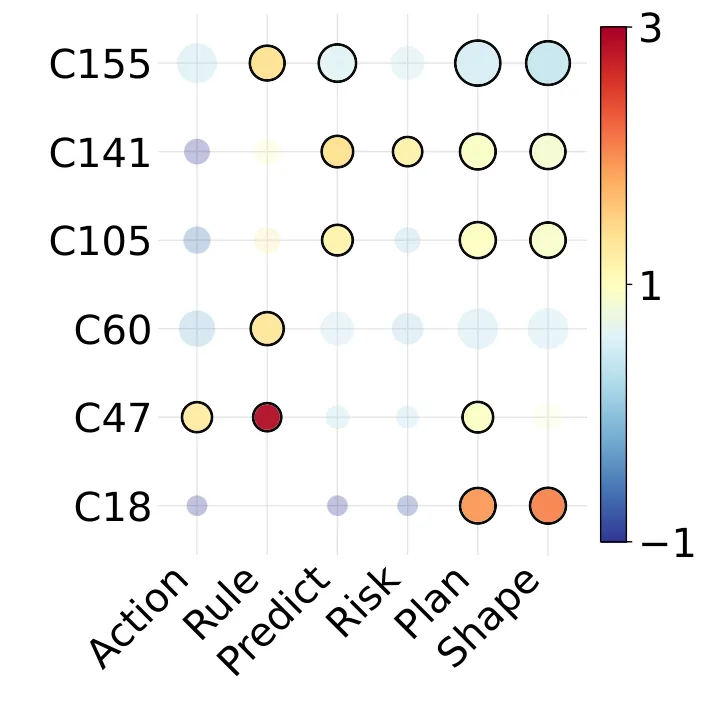
Figure 7: Cluster-level reflection failure modes. Bubble size indicates failure support, color indicates enrichment relative to the global baseline.
The fine-tuning ablation on the long-tail test set examines whether model-dependent hard samples provide more effective fine-tuning supervision than random samples. At evaluation the same rule is applied once to WILD-Nav-inst predictions on the long-tail test set to fix the tail definition; all fine-tuned models are evaluated on the identical set of sample ids without redefining the tail. Results show that random fine-tuning mainly preserves overall performance with limited tail benefit; hard-sample fine-tuning improves the tail more effectively but hurts the full test set; adding random samples on top achieves the best balance, keeping overall performance while minimizing tail error (ADE 0.217, FDE 0.160). Hard samples thus provide targeted supervision for failure cases, while replay data helps retain the broader navigation distribution.
| Method | Test-all ADE ↓ | Test-all FDE ↓ | Test-hard ADE ↓ | Test-hard FDE ↓ | Meta(%) ↑ |
|---|---|---|---|---|---|
| WILD-Nav-inst | 0.094 | 0.074 | 0.286 | 0.247 | 94.88 |
| +Random | 0.091 | 0.072 | 0.277 | 0.231 | 95.10 |
| +Hard | 0.121 | 0.102 | 0.230 | 0.165 | 96.83 |
| +Hard+Random | 0.093 | 0.079 | 0.217 | 0.160 | 96.73 |
Table 2: Ablation of incremental fine-tuning data on the long-tail test set (paper Table 3). The fixed tail is the union of the worst 3% ADE and FDE samples selected by WILD-Nav-inst.
| Dataset | Duration | Locations | Annotation |
|---|---|---|---|
| SCAND | 8.7 h | 1 | – |
| SiT | 0.4 h | 1 | 3D tracks and semantic maps |
| GND | 11 h | 10 | Semantic map |
| Citywalker | 200 h | 1 | Captions and instructions |
| Ours | 500 h | 30 | Navigation reasoning CoT |
Table 3: Comparison with real-capture and in-the-wild video urban navigation datasets (paper Table 1).
Limitations
The domain gap is not fully closed (author-stated). ADE and FDE after real-world fine-tuning still exceed those on the video test set, which the authors attribute to the real-world training set being much smaller than the video dataset and covering fewer visual and motion patterns. This means web video plus a small amount of robot fine-tuning is currently a valid adaptation path, but not yet an answer that replaces robot data.
Failure modes are statistical associations, not causal categories (author-stated). The paper explicitly warns that the identified patterns should be read as statistically supported local associations rather than exhaustive causal categories. Cluster-level enrichment tells which kind of reflective failure is more common in which kind of scene; it cannot be read directly as the sufficient cause of any single failure.
Open-loop evaluation and teacher dependence (this read's judgment). Evaluation on both the video and real test sets is single-step open-loop prediction of 5 waypoints, so ADE/FDE improvements are not directly equivalent to success or collision rates under closed-loop receding-horizon execution, and the paper reports no closed-loop metric. In addition, the teacher VLM carries both the training-annotation chain and the failure-attribution chain, so systematic teacher bias contaminates supervision and long-tail diagnosis at once, while the paper's quantification of teacher error is limited. Meta-action accuracy being lower for the think variant than for inst (93.4% vs 96.5%) also suggests the error path introduced by the reasoning chain deserves its own ablation.
Conclusion and Outlook
This paper binds learning urban navigation from web video and exposing the urban-navigation long tail into a single endeavor: the same 500 hours across 30 cities of in-the-wild walking video become more than half a million supervised samples through trajectory reconstruction and structured reasoning annotation, and simultaneously serve as a natural-distribution empirical testbed where rarity and model difficulty each measure the tail independently. With a frozen vision encoder, a shared reasoning representation and two lightweight decoding heads, WILD-Nav delivers planning accuracy better than UrbanNav and SocialNav on both video and real-world data; on the long-tail side it yields an actionable conclusion, namely that hard-sample fine-tuning combined with random replay is the best balance between tail gains and overall retention. For robotics researchers the real legacy may not be a particular model but a reusable methodology: when task data cannot predefine all hard situations, treating natural-distribution data as a measuring instrument is more valuable than treating it as fuel alone. Follow-up work naturally lands in three places: closed-loop evaluation protocols, uncertainty quantification of teacher annotation, and feeding the mined rare-and-hard episodes back as priorities for collection and synthesis.
Notable Quotes
Further progress depends not only on adding more samples but on whether the task data covers the situations that genuinely constrain model behavior.
Average performance hides high conditional error on specific sub-populations: the long tail is not seen, it is measured.
SOURCE LINKS