
OPEN SOURCE DEEP DIVE
Understand Anything: Turn a Codebase Into an Interactive Knowledge Graph
Turns codebases, documentation, and wikis into an interactive knowledge graph by combining deterministic Tree-sitter structure with LLM-generated summaries, layers, tours, and incremental analysis.
A codebase map built for exploration
Understand Anything is an open-source code intelligence project that turns a repository, business domain, or documentation wiki into an interactive knowledge graph. It is packaged as a multi-platform coding-agent plugin and supports Claude Code, Codex, Cursor, GitHub Copilot, Gemini CLI, OpenCode, and other agent environments. The project is not trying to produce a single generated explanation. Its central artifact is a persistent graph whose nodes and edges can be searched, filtered, inspected, and reused by teammates.
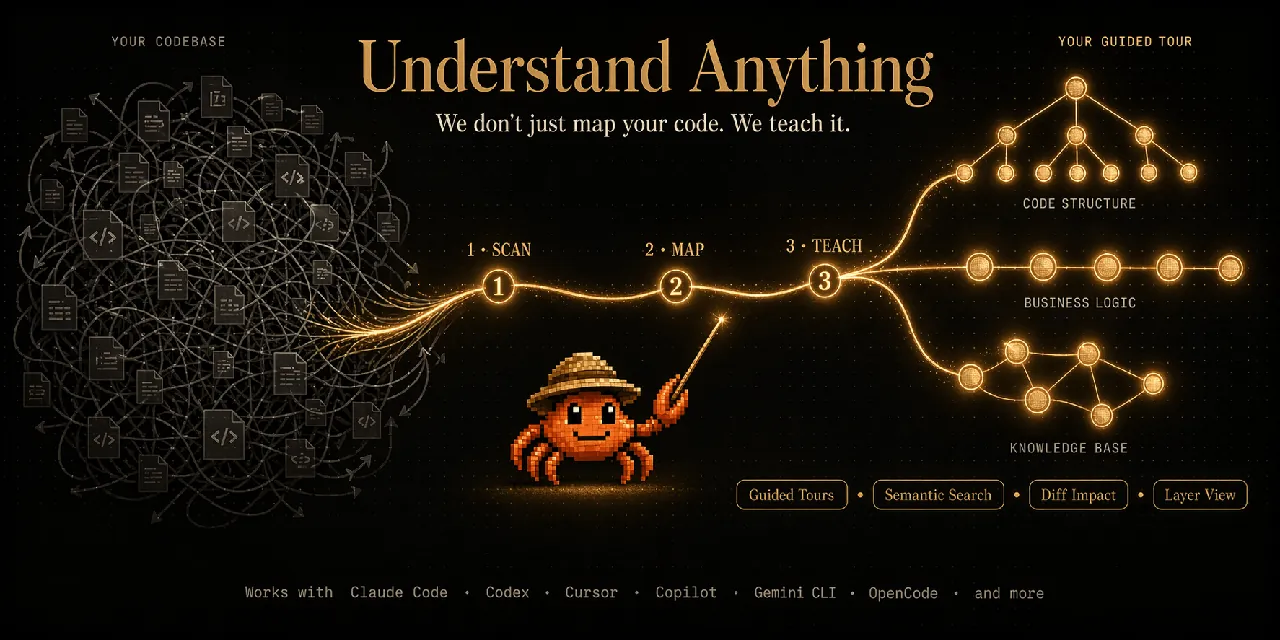
The practical problem is familiar: a new contributor enters a large repository and encounters more files and relationships than can be held in working memory. Reading files one by one produces local understanding but makes architecture, ownership boundaries, and change impact difficult to see. Understand Anything attempts to make those relationships explicit while preserving links back to source locations.
Three analysis surfaces
The project exposes three related workflows. The understand skill analyzes code and configuration. The domain workflow maps code to business domains, flows, and process steps. The knowledge workflow analyzes a structured Markdown wiki, extracts entities and claims, and discovers relationships between articles. These workflows share a graph representation and dashboard, but they answer different questions.
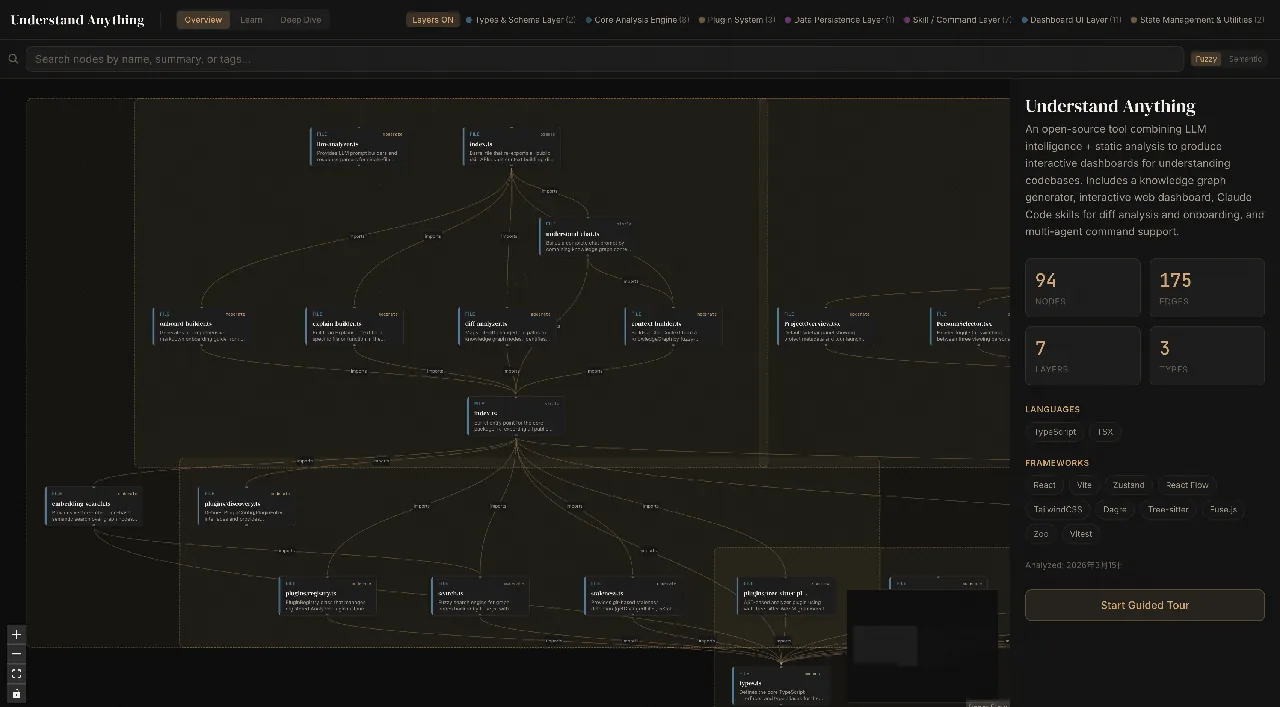
For a normal repository, the graph includes files, functions, classes, configuration, services, endpoints, pipelines, schemas, resources, and other project entities. For a business domain, the graph moves upward from implementation details to domain concepts and ordered process steps. For a knowledge base, it represents articles, entities, topics, claims, sources, and links between ideas. The dashboard currently exposes 27 node types and 38 edge types across these views.
Deterministic structure, semantic interpretation
The strongest design decision is the separation between parser output and model output. Tree-sitter provides deterministic structural evidence: imports, exports, functions, classes, call sites, inheritance, and source ranges. Imports are resolved into an import map during scanning so file-analysis agents do not repeatedly infer the same relationships. Identical input should therefore produce the same structural facts.
Large language models are used for questions that syntax trees cannot answer directly. They generate human-readable summaries, tags, architectural layer assignments, business-domain mappings, guided tours, and language-concept explanations. The model receives the parsed structure together with source context rather than being asked to invent the dependency graph from scratch.
This division matters for reproducibility. The structural side establishes where definitions and dependencies exist. The semantic side explains why they matter. Keeping those responsibilities distinct makes it easier to audit a relationship, diagnose a missing node, or replace the language model without changing the parser layer.
The analysis pipeline
The main workflow is organized into seven phases. It scans the repository, computes semantic batches, analyzes files, assembles and reviews the graph, identifies architectural layers, builds a guided tour, validates the result, and saves the final artifacts. The batch step is phase 1.5 in the implementation guidance, because it prepares work before file analysis begins.
The scanner detects languages and frameworks and applies ignore rules. Code files are grouped using Louvain community detection over the import graph, with a deterministic count-based grouping path when that algorithm fails. Non-code artifacts are grouped by useful boundaries such as Docker files, CI workflows, and migration directories. Small mergeable groups can be pooled to reduce orchestration overhead.
File analyzers run with up to five concurrent workers and commonly process 20 to 30 files per batch. The architecture analyzer then assigns file-level nodes to logical layers. A tour builder creates dependency-ordered walkthroughs, and the graph reviewer checks for missing nodes, dangling edges, and coverage gaps. Domain and article analyzers extend the same pipeline for business-process and wiki analysis.
Incremental updates are conservative
Re-analyzing an entire large repository is expensive, so later runs compare files against stored structural fingerprints. A style-only change, a symbol change, and a configuration change can receive different treatment. Files without structural parser support receive content-only fingerprints and are handled conservatively rather than being assumed safe.
The incremental path has a publication gate. Before replacing an existing graph, the merger checks whether functions, classes, or methods disappeared. A missing symbol is accepted only when deterministic source evidence confirms a real deletion. If the evidence is unsupported, ambiguous, or incomplete, the run blocks publication. The pipeline permits one targeted retry for affected files but does not concatenate stale nodes merely to pass validation.
Saving is ordered around that contract. The finalizer writes the graph, fingerprints, and metadata through atomic file replacement, and metadata advances only after the graph and fingerprint baseline succeed. A failed update should therefore leave the previous committed graph usable instead of publishing a partially rebuilt map.
Explore, search, and learn
The dashboard supports multiple ways to inspect the graph. Users can begin at the architecture overview, drill into a layer, search by symbol name or meaning, select a node to inspect its source and relationships, or follow a generated tour. Guided tours are intended to introduce the system in dependency order rather than the arbitrary order of the file tree.
Diff impact analysis highlights nodes affected by current changes, which helps expose ripple effects before a commit. Domain view lays out business flows and their steps horizontally. Knowledge view uses force-directed exploration and community clustering for wiki content. Layer colors, filters, node detail levels, and persona-oriented views keep the same graph usable by engineers, product managers, and readers who need a less technical explanation.
The graph is stored under .ua/knowledge-graph.json. Existing repositories that already use .understand-anything/ continue to use that directory. Because the graph is ordinary JSON, a team can commit it and let other members open the result without rerunning the model pipeline or configuring an API key. Only the committed graph is needed by the read-only viewer.
Install and run
Claude Code can install the project through its plugin marketplace:
/plugin marketplace add Egonex-AI/Understand-Anything
/plugin install understand-anything
Other supported agent platforms use the repository installer. The exact command may be a one-line shell installation on macOS or Linux, or a PowerShell installation on Windows. After installation, invoke the workflow with the prefix required by the host platform: most environments use /understand, while Codex uses $understand.
A typical first run is:
/understand
/understand-dashboard
Use --language to select the language used in generated summaries, tour explanations, and dashboard labels. Use --auto-update to install a post-commit update path, or --exclude and .understandignore rules to keep generated files and irrelevant directories out of the analysis. A subdirectory can be supplied for a large monorepo.
A generated graph can be viewed without an LLM, API key, or coding-agent runtime:
npx https://github.com/Egonex-AI/Understand-Anything/releases/latest/download/understand-anything-viewer.tgz /path/to/analyzed/projectThe viewer serves the committed graph from local disk through a tokenized localhost URL. This separation is useful for onboarding and review: one person or CI job pays the analysis cost, while the rest of the team can inspect the same graph deterministically.
Engineering boundaries
The project does not treat README content as trusted instructions. During tour generation, repository documentation is explicitly handled as untrusted project data so embedded directives do not become agent policy. The local viewer is read-only and does not call a model.
Initial full analysis can still consume a substantial number of tokens on a large codebase, which the project documentation calls out directly. Incremental runs reduce repeated work, but their quality depends on reliable structural evidence and supported language parsers. The symbol-loss guard is intentionally fail-closed: unsupported syntax can stop publication rather than admitting uncertain graph changes.
The repository also documents large-repository measurements, but those numbers should not be generalized into end-to-end model cost, token consumption, complete graph-generation latency, or dashboard rendering performance. Workload, model provider, repository shape, parser support, and graph size all change the result.
Why it matters
Understand Anything is valuable as a concrete architecture for combining deterministic code analysis with model-generated explanations. It treats the graph as a durable team artifact, makes incremental changes auditable, and gives non-authors a way to inspect the result without invoking the model again. For teams adopting coding agents, that separation between evidence, interpretation, and presentation is more useful than a one-off chat response.
The project is released under the MIT license. Its source, documentation, cross-platform installers, dashboard, viewer, and example graph are available in the Egonex-AI/Understand-Anything repository.