

AI Has Not Created a Layoff Wave. It Has Narrowed the Entry-Level Gate.
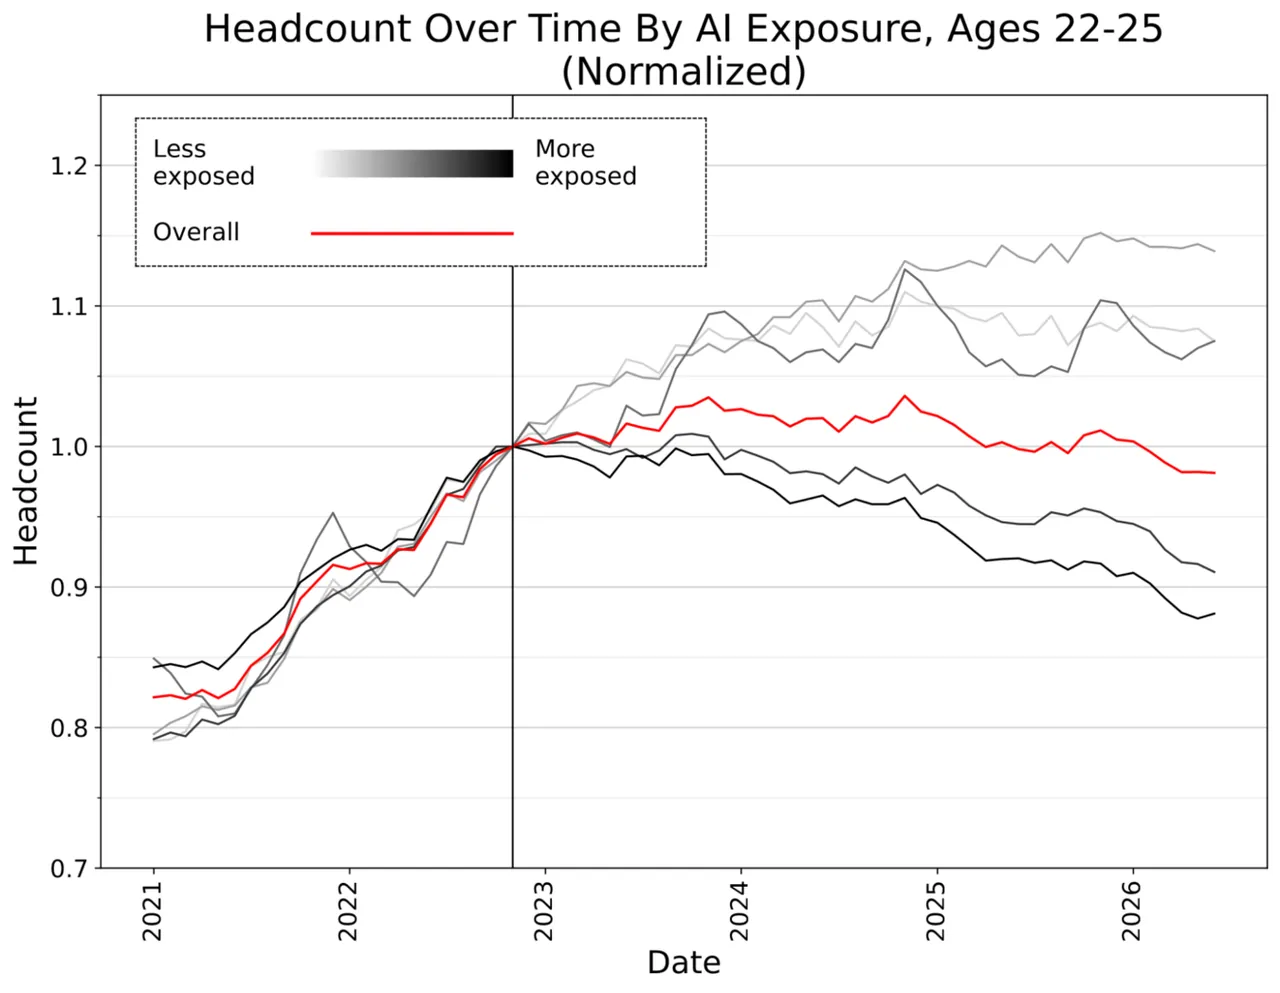
Stanford payroll data show no broad layoff wave, but employment for ages 22-25 in highly AI-exposed occupations sits about 19% below its kept-pace path, driven by reduced hiring.
The public conversation about artificial intelligence and work keeps collapsing into two unsatisfying stories. One says that a wave of automation is already pushing large numbers of people out of their jobs. The other points to a stable unemployment rate and concludes that the labor-market effect is mostly hype. The August 2026 edition of Stanford Digital Economy Lab's Canaries in the Coal Mine? finds a more specific and more uncomfortable pattern: the economy does not look like it is experiencing a broad displacement wave, but the path into employment has become materially narrower for the youngest workers in the occupations most exposed to generative AI.
The study's most quoted figure is 19%. It does not mean that 19% of young employees were laid off. It does not mean that all entry-level employment has fallen by 19%, and it does not establish that AI alone caused the difference. It means that employment among 22-to-25-year-olds in the two most AI-exposed fifths of occupations is about 19% below the level it would have reached if it had grown at the roughly 10% rate seen among similar young workers in the three least-exposed fifths.
That distinction is the whole argument. The finding is about a widening gap between two career paths, not a body count. It is also a descriptive warning rather than a causal verdict. The authors describe these results as "early, descriptive indicators" and explicitly say they are not causal estimates. Policy and career decisions should preserve that uncertainty, while still taking the observed pattern seriously.
1. The headline is narrower than it sounds
The safest summary is: no visible economy-wide layoff wave, but a more selective entry gate. Both halves matter. A labor market can remain near full employment while becoming harder to enter. Incumbent workers may keep their jobs, employers may slow replacement hiring, and the burden can concentrate on people who have not yet crossed the threshold.
This is why aggregate unemployment is a poor detector for the phenomenon. Young workers in the most exposed occupations are a small subset of the whole labor market. Even a visible change in their employment trajectory can disappear inside an aggregate that contains millions of older workers, less-exposed occupations, and firms outside the measurement panel. A single national trend line answers a question about the whole system; it does not answer a question about who can get through its doors.
The distinction also changes the metaphor. A “canary” is not a proven cause of the mine's condition. It is an early, observable signal that deserves investigation. The Stanford paper adopts that metaphor deliberately. The authors are not claiming to have isolated the causal effect of ChatGPT or any other model. They are presenting a timely, granular pattern that other explanations must confront.

2. What the ADP payroll data can see
The analysis uses anonymized administrative payroll records from ADP, which provides payroll services for firms employing more than 26 million workers in the United States. The main analysis sample is a balanced panel of firms observed monthly from January 2021 through June 2026, containing roughly 3.5 million to 5 million full-time workers under age 70 in each month. These are payroll records, not survey responses or scraped job listings, which makes it possible to observe who is actually being paid, when they enter, when they leave, and how base compensation changes.
The authors classify occupations by measured exposure to generative AI and place them into quintiles. They then compare employment growth by age and exposure group. The core comparison is not a before-and-after estimate for one occupation. It is a long-difference comparison between more- and less-exposed occupations over the period after ChatGPT's public release, supported by event-study and regression checks.
| Element | What the study measures | Why it matters |
|---|---|---|
| Data source | Anonymized ADP payroll records | Administrative payment data rather than self-reported employment status |
| Coverage | ADP serves firms with more than 26 million U.S. workers | Large and high-frequency, but not a random sample of the entire economy |
| Analysis panel | Roughly 3.5-5 million full-time workers under 70 per month | Supports age-by-occupation cuts that national aggregates can miss |
| Window | January 2021 through June 2026 | Includes both pandemic disruption and the generative-AI period |
| Primary outcome | Headcount by age and AI-exposure quintile | Shows the stock of employment, not merely employer intentions |
| Interpretive status | Descriptive facts, not causal estimates | The pattern is evidence to track, not proof that AI produced every difference |
ADP data has real advantages: it is timely, large, and grounded in actual payments. It also has known limits. The panel skews toward larger, established employers; the paper reports that exposed occupations are overrepresented relative to the national economy; and the sample cannot fully represent new business formation. Results that are clear inside this panel may therefore be smaller or noisier in national surveys. That is not a reason to discard them, but it is a reason not to convert one payroll panel into a universal law.
3. Four numbers behind the 19%
Over the period from November 2022 to June 2026, employment for 22-to-25-year-olds in the two most AI-exposed quintiles fell by about 11%. Employment for the same age group in the three least-exposed quintiles rose by about 10%. The difference between those growth rates is 21 percentage points.
The 19% is a relative shortfall, not the absolute decline and not the percentage-point gap. If the exposed group had grown by the low-exposure group's approximately 10%, its end-of-period employment would have been much higher. The observed level is about 19% below that hypothetical kept-pace level. This is why both “11% decline” and “19% below trend” can be true at the same time without describing the same calculation.
| Measure | Result | Correct interpretation |
|---|---|---|
| High-exposure employment growth, ages 22-25 | About -11% | Absolute change within the two most-exposed fifths |
| Low-exposure employment growth, ages 22-25 | About +10% | Change within the three least-exposed fifths |
| Growth gap | About 21 percentage points | Difference between two growth rates |
| Kept-pace shortfall | About 19% | How far high-exposure employment sits below its level if it had matched low-exposure growth |
| July 2025 vintage | 15% shortfall | Earlier version of the same descriptive measure |
| June 2026 vintage | 19% shortfall | The divergence widened as more payroll months arrived |
The time path is important because it rules out a single-month artifact. The kept-pace shortfall was 15% in the July 2025 data release and widened to 19% by June 2026. That does not prove a continuing AI effect, but it makes the pattern harder to dismiss as a temporary reopening shock. Something in the composition of hiring and employment was still changing well after the initial post-pandemic disruption.
4. Aggregate growth is not a clean bill of health
Across all age groups, average employment in the ADP sample rose about 6% between November 2022 and June 2026. Even the most AI-exposed quintile grew about 4% when all ages were pooled. The 22-to-25 group as a whole declined only about 2%, because growth in less-exposed occupations offset much of the contraction elsewhere. Workers aged 35 to 40 grew about 11%.
Those are not the numbers of a general labor-market collapse. They are the numbers of a labor market whose aggregate can hide a sharp change in age-specific access. The two high-exposure quintiles accounted for about 57% of employment among 22-to-25-year-olds at the start of the comparison, so their roughly 11% decline removed about 6 percentage points from the age group's overall path. Less-exposed occupations absorbed much, but not all, of that loss.
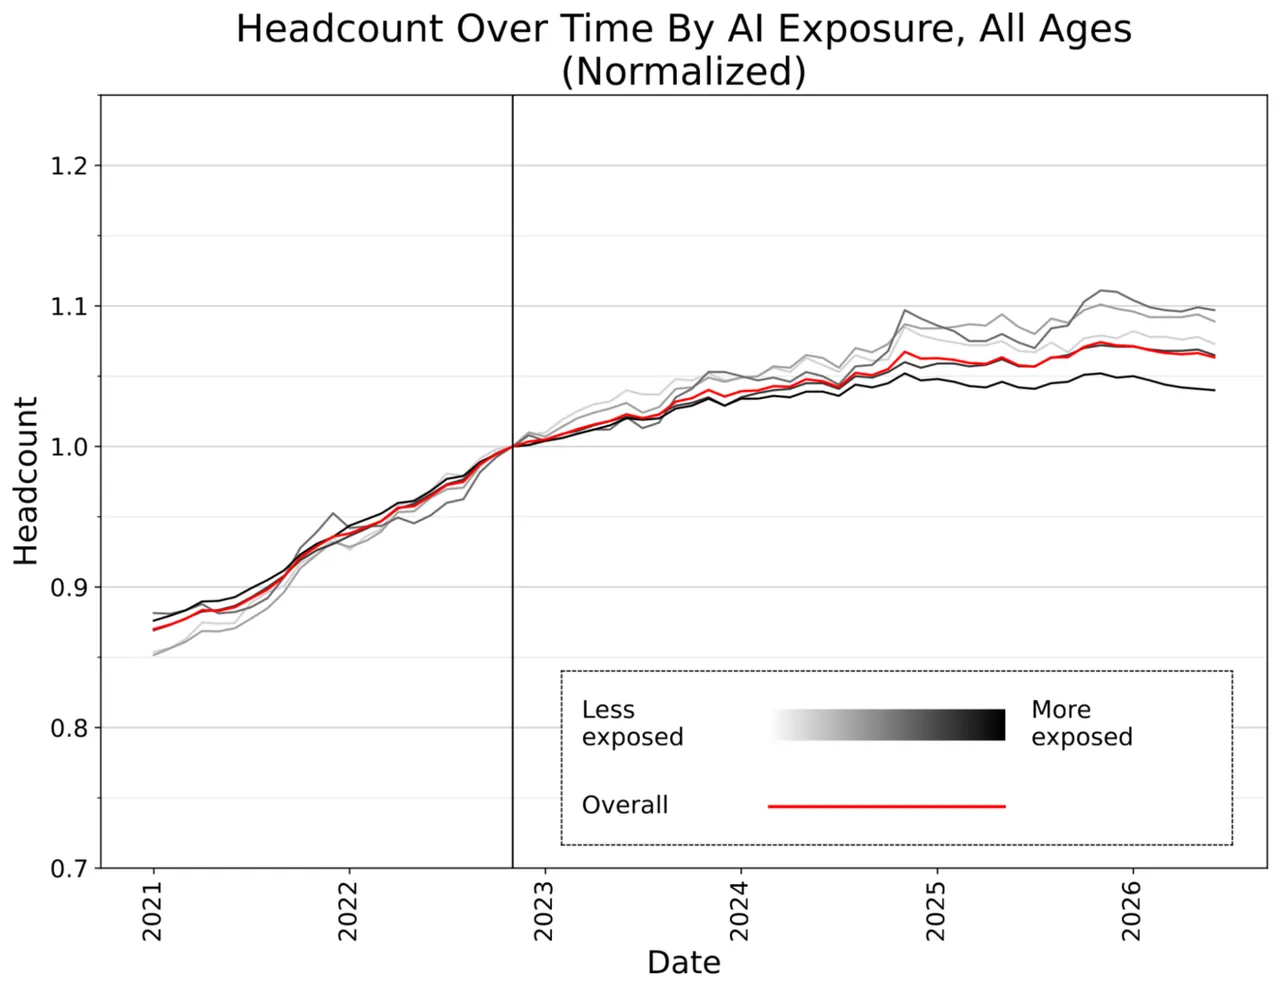
The most exposed quintile can grow in total while its entry-level segment contracts. Experienced workers are a larger share of the occupational stock and show no comparable gap across exposure groups. A company can preserve its current staff, avoid conspicuous layoffs, and still reduce the number of junior positions through attrition or slower replacement. Macro observers then see continuity, while a cohort of graduates sees fewer first rungs.
The finding also shows why “AI exposure” is not a synonym for “AI replacement.” An occupation may use AI, be discussed extensively, and still expand. The relevant economic question is not whether a task can be automated in isolation. It is how firms reorganize employment after the cost of performing that task falls. Demand for the output can rise, some tasks can be reassigned, incumbents can become more productive, and the number of newcomers needed for training or execution can fall. Those effects can point in different directions.
5. The entry gate narrows through hiring, not a layoff wave
The study separates employment stocks into hiring and separations. If high-exposure occupations were displacing experienced workers, separations should rise relative to low-exposure occupations. Through June 2026, the opposite pattern is more consistent with the data. Hiring and separation rates both fell across much of the labor market, producing a “low-hire, low-fire” environment. Among young workers, separation rates fell at least as much in the most exposed occupations as in the least exposed ones.
The divergence instead appears on the hiring side. Firms became less likely to bring in a young worker into an exposed occupation, while incumbents remained unusually insulated. This matters for how the result should be described. A layoff story points to people already inside the organization being pushed out. A hiring story points to people outside the organization who cannot get in. The second can produce a large cohort-level loss without generating a dramatic monthly separation series.
| Channel | What a displacement story predicts | What the study observes |
|---|---|---|
| Hiring | May fall, but usually alongside visible job cuts | Entry-level hiring falls substantially in exposed occupations |
| Separations | Should rise in exposed jobs | Separations do not explain the divergence and fall at least as much in exposed jobs |
| Incumbent employment | Would weaken across age groups | Experienced workers show no comparable exposure gap |
| Base pay | Could fall if employers use AI to push down wages | Little evidence of a significant exposure penalty in starting base salary |
| Organizational effect | Current workers are removed | The junior pipeline is reduced while the existing stock is retained |
Compensation is the other important non-result. The study finds little significant relationship between AI exposure and starting base salary for young workers. Base salary excludes bonuses, overtime, commissions, equity, and tips, so this is not a complete measure of compensation. It is still enough to challenge a simple prediction that firms would keep hiring the same number of juniors at visibly lower pay. The observed adjustment is more like fewer offers than cheaper offers.
That has a distributional consequence. A hiring cutoff can protect people already inside while making the transition from education to work more competitive. It can also hide the cost inside unpaid search time, additional education, temporary work, or moves into occupations with weaker long-run paths. None of those outcomes appears as a layoff in a payroll panel. The absence of a severance event is not the absence of a career shock.
6. Automation and augmentation behave differently
The paper goes beyond a single “AI exposure” score. Using Anthropic's Economic Index, it classifies AI use associated with occupations as primarily automative, augmentative, or neither. The distinction is descriptive, but it is economically meaningful: using AI to complete a whole task is not the same as giving a worker a faster tool for part of the task.
In the March 2025 release, a one-standard-deviation increase in automation-oriented usage is associated with an employment coefficient of about -0.098 for workers aged 22-25. The pooled later releases produce about -0.084. The negative association weakens with age. Complementarity has no comparable penalty for the young and is positive for experienced workers, about +0.024 for ages 41-49.
| Age group | Automation exposure, March 2025 | Automation exposure, pooled later releases | Complementarity association |
|---|---|---|---|
| 22-25 | -0.098 | -0.084 | +0.016; -0.010 later |
| 26-30 | -0.036 | -0.041 | +0.010; -0.002 later |
| 31-34 | -0.017 | -0.018 | +0.014; -0.001 later |
| 35-40 | -0.014 | -0.018 | +0.004; -0.012 later |
| 41-49 | -0.008 | -0.008 | +0.024; +0.024 later |
The cleanest interpretation is not that every use of AI harms young workers. The age gradient appears specifically when usage is classified as automation. It is weaker or absent where AI is classified as augmentative, and experienced workers can benefit from complementary tools. That is the paper's most direct mechanism evidence, but it remains observational. The Anthropic usage index tells researchers what kinds of prompts are associated with an occupation, not what every employer actually deployed or why a particular vacancy disappeared.
7. Codified knowledge versus tacit knowledge
The authors also test a second mechanism: perhaps generative AI substitutes most readily for codified knowledge, the formal and standardized material that can be written in textbooks, procedures, and specifications. Tacit knowledge is different. It is acquired through practice, mentorship, and repeated exposure to messy situations: resolving conflict, coaching a team, judging an ambiguous operational failure, or knowing when a standard procedure should not be applied.
Occupations that rely more heavily on codified knowledge show slower entry-level employment growth. Occupations that rely more heavily on tacit knowledge show faster employment growth for mid-career and senior workers. This is directionally consistent with the idea that large language models are good at retrieving, transforming, and producing explicit knowledge while still complementing people who have accumulated practical judgment.
The result is weaker than it first appears. The codified-knowledge gradient loses statistical significance after controlling for the college share of an occupation. That attenuation can be read in two ways. It may mean education is an alternative explanation: occupations requiring degrees faced their own hiring slowdown. It may also mean education is part of the mechanism: AI directly affects tasks that overlap with what colleges teach. The available data cannot distinguish those interpretations. By contrast, the tacit-knowledge advantage for experienced workers survives the education control.
This is exactly where careful language matters. “AI replaces codified knowledge” is too strong. The defensible statement is narrower: in this sample, occupations associated with explicit, formalizable knowledge have weaker early-career employment paths, and that association overlaps heavily with education. The pattern is useful for generating hypotheses and for monitoring job design. It is not a causal decomposition of every junior role.
8. OpenAI's usage data adds a different kind of evidence
OpenAI's October 2026 Signals release maps work-related consumer ChatGPT messages to 165 O*NET Intermediate Work Activities across nearly 100 countries, from the first quarter of 2025 through the third quarter of 2026. In the 74 countries observed in every quarter, the ten most common activities represented an average of 51.1% of classified work messages in Q3 2026, down from 56.0% in Q1 2025.
That decline means work-related ChatGPT use became less concentrated in a handful of tasks. It does not mean workers became more productive, that employment changed, or that AI replaced anyone. It is a distribution of usage. The release covers individual ChatGPT plans and excludes enterprise ChatGPT messages and Codex use, so it likely understates business deployment. It also reports that about 43% of the employment-weighted mapped U.S. task mix falls into “Other IWAs” outside the individually reported categories.
| OpenAI usage finding | What it supports | What it cannot establish |
|---|---|---|
| 165 mapped work activities | AI use is spread across a broad taxonomy of tasks | Whether those tasks are completed well or replace labor |
| Nearly 100 countries | Cross-country variation can be compared | A representative census of all workers |
| Top-ten share fell from 56.0% to 51.1% | Usage became less concentrated in a few activity types | A change in total usage, employment, or productivity |
| Individual plans only | Consumer-facing work behavior is visible | Enterprise workflows and Codex usage are excluded |
| About 43% falls into Other IWAs | Mapped comparison has substantial omitted categories | A complete one-to-one map between ChatGPT and the economy |
Read alongside the payroll study, OpenAI's data supports one limited conclusion: generative AI is being used across a widening set of work activities, not merely as a single writing or coding utility. That makes the automation-versus-augmentation distinction more relevant, not less. But the usage data cannot tell us which workers gained, which vacancies closed, or whether a task disappeared from an occupation. The ADP evidence is about employment stocks; the Signals evidence is about message activity. Combining them is useful only if each dataset keeps its own limits.
9. Alternative explanations deserve room
The study does not ignore competing stories. It tests several. The young-worker divergence remains when technology firms and computer occupations are removed, when occupational interest-rate exposure is controlled, when remote-work measures are added, and across five alternative AI-exposure classifications. These checks weaken a simple “this is only a tech-sector correction” explanation. They do not eliminate every macroeconomic alternative.
Education is the strongest attenuator. In the primary long-difference sample, the most-exposed quintile coefficient for ages 22-25 ranges from about -0.18 to -0.09 under the education-control specifications, with estimates at the edge of the range significant at the 10% level. In the sample balanced since 2021, the corresponding range is about -0.19 to -0.06 and is not statistically significant. The authors argue that education may be both a confounder and a channel, but they do not claim to resolve the ambiguity.
There are also pre-existing trends. More- and less-exposed occupations already diverged at points during and before the pandemic. By November 2022, the relative position of exposed occupations had largely returned to its pre-pandemic baseline, and the later decline moved below that baseline rather than simply continuing the pandemic recovery. The divergence also continued after interest rates peaked. These observations make the AI-era timing harder to dismiss, but they do not make the comparison a randomized experiment.
Finally, national survey benchmarks show a directionally consistent but smaller and noisier pattern than the ADP panel. That is exactly what one should expect if each source has different coverage and measurement error. It supports triangulation, not certainty. The authors use administrative data, a nationally representative survey, and government administrative evidence together, but the core caution remains: the paper is documenting a pattern that needs continued measurement.
| Confidence level | What is well supported | What remains uncertain |
|---|---|---|
| High within the paper | The age-by-exposure divergence exists in the ADP panel and widens through June 2026 | How much of it is caused by generative AI rather than correlated changes |
| Moderate | Reduced hiring, not increased separations, explains the employment-stock gap | How general the result is beyond ADP's employer mix |
| Suggestive | Automation-oriented use is associated with the largest young-worker declines | Whether the Anthropic usage classification captures actual employer deployment |
| Fragile | Codified knowledge may be more exposed; tacit knowledge may protect experience | The codified result attenuates substantially after education controls |
| Not established | AI caused a nationwide reduction of 19% in entry-level jobs | That sentence is not supported by the paper or by the data |
10. What the evidence implies in practice
The following implications are interpretation, not findings from the paper. They follow from the observed combination of low hiring, stable incumbent employment, and an automation gradient.
For people entering the labor market, the old strategy of demonstrating that you can complete a tidy, standardized task is becoming less distinctive. A tool can already produce a draft, summarize a document, generate baseline code, or populate a routine worksheet. The stronger signal is the ability to define a problem, check an output against evidence, explain tradeoffs, and take responsibility for an ambiguous result. That is not a guarantee of employment. It is a response to the direction in which the comparative advantage appears to be moving.
For managers, cutting junior hiring can look efficient in a single budget cycle and become expensive several years later. If an organization stops creating the conditions in which people learn judgment, it may save on entry-level payroll while thinning the future pool of people who can supervise complex work. The paper's mechanism evidence suggests that automation of checkable tasks is not equivalent to eliminating the need for experience. The useful question is which tasks can be delegated to a model and which tasks should remain a training path for people.
For educators and workforce programs, adding an AI tool to a course is not the same as preparing people for the new gate. Students still need domain knowledge, but they also need supervised practice in verification, exception handling, client communication, and team coordination. A portfolio of finished outputs may be less informative than evidence of how the student found an error, revised a plan, or made a judgment under incomplete information.
For researchers and policymakers, the unit of analysis should remain age, occupation, hiring flow, and task content, not only aggregate unemployment. A labor market can look healthy while a cohort loses access to the jobs that historically served as its training ground. Monthly dashboards should report the entry rate alongside the separation rate. They should also separate automation-oriented use from augmentation-oriented use, because the paper suggests that these are not interchangeable.
11. What would change the interpretation
Several future observations would weaken or strengthen the canary hypothesis. A sustained rebound in junior hiring within the most exposed occupations, accompanied by rising separation rates among incumbents, would make the current pattern look more like a temporary post-pandemic reallocation. A continued divergence in payroll data, replicated in other countries and in datasets that better represent small firms, would make the AI explanation harder to resist.
More direct firm-level evidence would be especially valuable. Researchers need to connect actual model deployment, task redesign, vacancy openings, and hires. An occupation-level exposure score cannot show whether a bank replaced a document-review task, a software team changed its interview pipeline, or a customer-service department consolidated three junior roles into one augmented role. Those mechanisms may produce the same aggregate line while requiring very different policy responses.
The strongest conclusion available now is therefore conditional: if the pattern persists and survives better causal designs, the first-order labor-market effect may be a change in who gets admitted rather than a mass exit by people already employed. That is less cinematic than a replacement wave and more actionable for institutions. It points to the design of apprenticeships, first-job pipelines, internal training, and hiring criteria, not only to unemployment insurance.
12. The gate, not the wave
The Stanford paper does not prove that AI has caused a 19% collapse in entry-level opportunity. It does show that, in a large administrative payroll panel, young workers in the most AI-exposed occupations fell far behind their less-exposed peers, that the gap widened through mid-2026, and that the adjustment appears primarily through hiring rather than separations. It also finds a suggestive automation gradient and a weaker, education-sensitive story about codified knowledge.
OpenAI's usage data adds context: work-related generative-AI use is broadening across activities and countries. It does not tell us who lost a job. The payroll evidence asks the sharper distributional question, while the usage evidence describes the spread of the tool. Keeping those claims separate is the difference between useful analysis and another round of automation prophecy.
The practical headline is not “AI is taking all the jobs.” It is more precise and more useful: AI has not yet produced a broad layoff wave, but the evidence is consistent with a narrower entry gate in the most exposed occupations. That sentence leaves room for uncertainty and still gives employers, educators, and new workers something concrete to watch.
Sources and further reading
Erik Brynjolfsson, Bharat Chandar, and Ruyu Chen, “Canaries in the Coal Mine? Six Facts about the Recent Employment Effects of Artificial Intelligence”, Stanford Digital Economy Lab, August 2026.
Stanford Digital Economy Lab, publication page and August 2026 research update.
OpenAI, “ChatGPT's expanding world of work” and OpenAI Signals data, October 2026.
Story seed: Underleveled Builder's X article. Claims from the post were checked against the Stanford paper and OpenAI release; secondary claims that could not be verified were omitted.
Source:Stanford Digital Economy Lab / OpenAI Signals(选题:Underleveled Builder)https://x.com/UnderleveledDev/status/2116429843823005807